
The US national debt, also known as the public debt, refers to the total amount of money owed by the federal government to its creditors. This debt has been increasing for many years, and it is projected to reach $41 trillion by 2026.
There are a number of factors that have contributed to the rising of our national debt, including increased government spending on programs such as Social Security and Medicare, as well as economic downturns and recessions. Additionally, tax cuts and other policies have also played a role in increasing the debt. The issue of the national debt is a contentious one, with some arguing that it is a serious problem that needs to be addressed, while others argue that it is not as big of a concern as it is often made out to be.
The potential consequences of the rising US national debt should be a serious concern. For instance, the government might be more limited in its ability to respond to future economic downturns, which can lead to more severe recessions and higher unemployment. Additionally, large levels of debt can also lead to higher interest rates, inflation, and exchange rate volatility, which can affect economic growth.

It is important to note that the National debt is also in a large part financed by bonds, and those are held by investors and institutions like social security trust funds, insurance companies and even foreign governments, the government can continue to borrow and service the debt as long as the economy and the country’s creditworthiness remains stable.
Overall, the increasing national debt is a complex issue with no easy solutions. In terms of historical numbers, the national debt has fluctuated over the years, increasing during times of war or economic downturns, and decreasing during times of peace and economic growth.
Here are a few key milestones:
- In 1913, the year the Federal Reserve was created, the debt was around $2.9 billion.
- In 1920, after the end of World War I, the debt peaked at around $25.5 billion.
- In 1946, after the end of World War II, the debt peaked at around $270 billion.
- In 1981, after several years of high inflation and economic turmoil, the debt surpassed $1 trillion for the first time.
- In 1996, the debt was around $5.4 trillion.
- 2016, the public debt was more than $19 trillion. That’s more than triple in less than 20 years.
Now, let’s consider the US National Debt by Year Since 2000 to 2022
- 2000: the national debt at the end of 2000 was around $5.7 trillion. That was an increase from around $5.6 trillion in 1999.
- 2001: The debt was around $5.8 trillion at the end of the year, this increased significantly after the launch of the war on terror and the invasion of Afghanistan.
- 2002: The debt was around $6.1 trillion at the end of the year.
- 2003: The debt was around $6.8 trillion at the end of the year, this increased significantly after the launch of the war on terror and the invasion of Iraq.
- 2004: The debt was around $7.4 trillion at the end of the year.
- 2005: The debt was around $7.9 trillion at the end of the year.
- 2006: The US national debt was around $8.5 trillion at the end of the year.
- 2007: The US national debt was around $9 trillion at the end of the year.
- 2008: The debt was around $10.6 trillion at the end of the year; this was the first-time debt surpassed $10 trillion.
- 2009: the debt was around $11.9 trillion at the end of the year, the debt increased rapidly due to the economic stimulus package passed in response to the financial crisis.
- 2010: the debt was around $13 trillion at the end of the year.
- 2011: the debt was around $14.5 trillion at the end of the year.
- 2012: the debt was around $16 trillion at the end of the year.
- In 1913, the year the Federal Reserve was created, the debt was around $2.9 billion.
- 2014, the debt was around $17.5 trillion at the end of the year.
- 2015, the debt was around $18 trillion at the end of the year.
- 2016, the debt was around $19 trillion at the end of the year.
- 2017, the debt was around $20 trillion at the end of the year, this increase is due to the fact that the government borrowed more than usual because of the tax cut.
- 2018, the debt was around $21.5 trillion at the end of the year.
- 2019, The debt was around $22 trillion at the end of the year.
- 2020, during the outbreak of pandemic the total national debt grew rapidly and reached around $27 trillion by the end of the year.
- In 2021, the total national debt of the United States was over $28 trillion, as I previously mentioned.
- In 2022, the US National debt was more than 31 trillion U.S. dollars, about 2.3 trillion more than 2021.
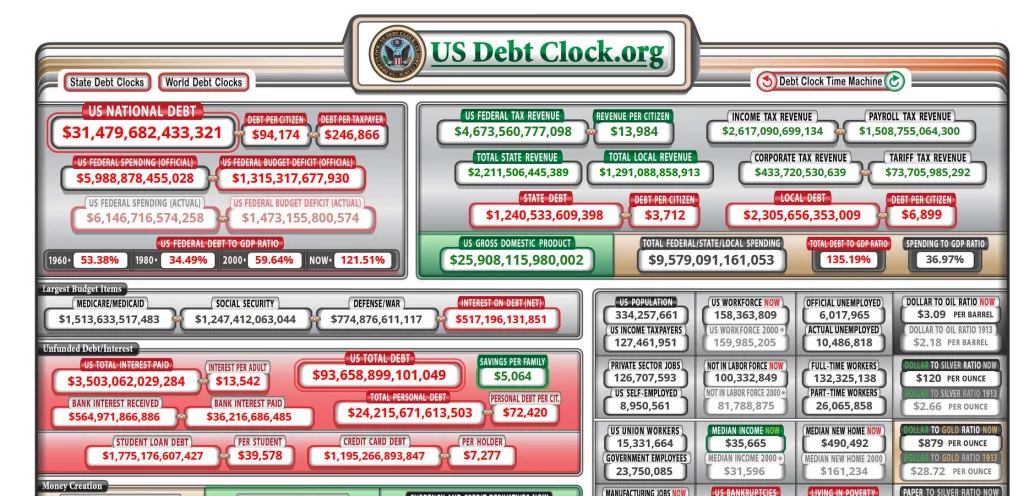
It is important to note that these figures are not adjusted for inflation, so the figures in dollar terms might not give an accurate sense of the size of the debt relative to the economy. The debt-to-GDP ratio, which compares the national debt to the country’s Gross Domestic Product, is a more informative metric. You can also find more information about the US national debt by searching for “U.S. national debt clock“.
Also, keep in mind that the debt figures I’ve provided here are rounded and may not be precise. The actual debt figures can be found on the website of the Department of Treasury and other official government sources.