
Table of Contents
[ad_1]
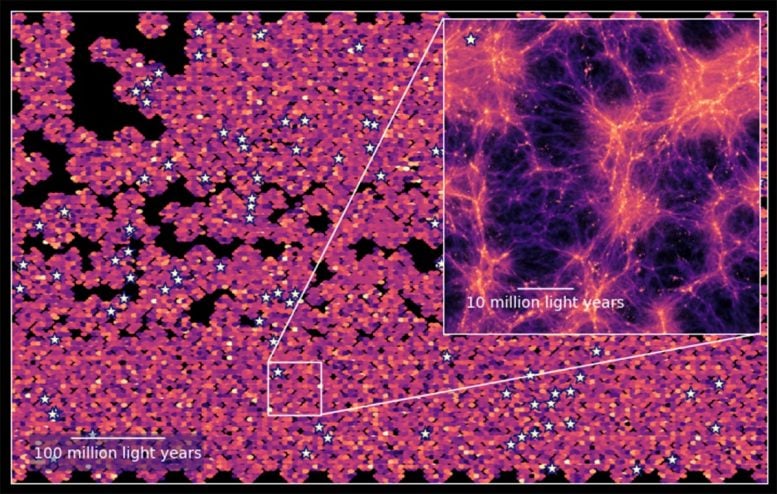
Astronomers have uncovered a hidden cosmic web of galaxies and gas by mapping hydrogen light from the early universe.
Astronomers working with the Hobby-Eberly Telescope Dark Energy Experiment (HETDEX) have produced the most detailed three-dimensional map yet of light emitted by energized hydrogen in the early universe. The map traces light from a period between 9 billion and 11 billion years ago.
This light, known as Lyman alpha, is produced when hydrogen atoms absorb energy from nearby stars. Because this signal is so strong around regions of active star formation, astronomers often use it to locate bright galaxies in the distant universe. However, the positions of dimmer galaxies and faint clouds of gas that also emit Lyman-alpha light have remained mostly unknown.
“Observing the early universe gives us an idea of how galaxies evolved into their current form, and what role intergalactic gas played in this process,” said Maja Lujan Niemeyer, a HETDEX scientist and recent graduate from the Max Planck Institute for Astrophysics who led the development of the map. “But because they are far away, many objects in this time are faint and difficult to observe.”
To reveal these faint sources, researchers used a method called Line Intensity Mapping. The resulting map highlights previously unseen structures and offers a clearer view of this important stage in cosmic history. The results were published on March 3 in The Astrophysical Journal.
How Line Intensity Mapping Reveals Hidden Galaxies
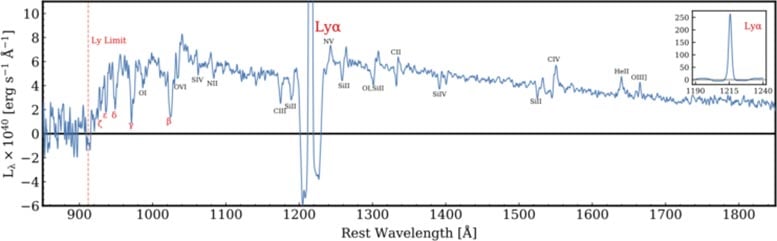
Light can be separated into its component wavelengths, producing what scientists call a spectrum. Astronomers study spectra (the plural of “spectrum”) by identifying peaks and dips that indicate the presence of particular elements.
Instead of identifying individual galaxies one at a time, Line Intensity Mapping measures how strongly a specific element appears across a large region of space. This approach allows scientists to detect the combined glow of many faint sources at once.
“Imagine you’re in a plane looking down. The ‘traditional’ way to do galaxy surveys is like mapping the brightest cities only: you learn where the big population centers are, but you miss everyone that lives in the suburbs and small towns,” explained Julian Muñoz, a HETDEX scientist, assistant professor at The University of Texas at Austin, and co-author on the paper. “Intensity mapping is like viewing the same scene through a smudged plane window: you get a blurrier picture, but you capture all the light and not just the brightest spots.”
Massive Dataset From the Hobby-Eberly Telescope
Although Line Intensity Mapping itself is not new, this study marks the first time the method has been used to map Lyman alpha emission with such a large dataset and high level of precision.
Using the Hobby-Eberly Telescope at McDonald Observatory, HETDEX is measuring the positions of more than one million bright galaxies as part of an effort to better understand dark energy. The project has collected an enormous amount of information, including more than 600 million spectra across a region of sky covering an area equivalent to more than 2,000 full Moons.
“However, we only use a small fraction of all the data we collect, around 5%,” explained Karl Gebhardt, HETDEX principal investigator, chair of UT Austin’s astronomy department, and co-author on the paper. “There’s huge potential in using that remaining data for additional research.”
“HETDEX observes everything in a patch of sky, but only a tiny amount of that data is related to the galaxies that are bright enough for the project to use,” added Lujan Niemeyer. “But those galaxies are only the tip of the iceberg. There’s a whole sea of light in the seemingly empty patches in between.”
Supercomputers Reveal Hidden Cosmic Structure
To construct the map, the researchers created specialized software and relied on supercomputers at the Texas Advanced Computing Center to analyze roughly half a petabyte of HETDEX observations.
The team then used the positions of bright galaxies already cataloged by HETDEX to estimate where fainter galaxies and glowing gas clouds are likely located nearby. Because gravity pulls matter together into clusters, bright galaxies often indicate regions where additional objects are concentrated.
“So, we can use the location of known galaxies as a signpost to identify the distance of the fainter objects,” said Eiichiro Komatsu, a HETDEX scientist, scientific director at the Max Planck Institute for Astrophysics, and co-author on the paper. The completed map sharpens the view around bright galaxies while also revealing new detail in the previously unexplored regions between them.
“We have computer simulations of this period,” continued Komatsu. “But those are just simulations, not the real universe. Now we have a foundation which can let us know if some of the astrophysics underpinning those simulations is correct.”
A New Era for Mapping the Cosmos
The researchers now plan to compare their map with other surveys that examine the same region of the universe but focus on different elements. For instance, a Line Intensity Map of carbon monoxide – which is associated with the dense, cold clouds where stars form – could provide new clues about the environments surrounding young stars that produce Lyman alpha light.
“This study is a first detection, which is exciting on its own, and it opens the door to a new era of intensity-mapping the universe,” said Muñoz. “The Hobby-Eberly is a pioneering telescope. And with new, complementary instruments coming online, we’re entering a golden age for mapping the cosmos.”
Reference: “Lyα Intensity Mapping in HETDEX: Galaxy-Lyα Intensity Cross-power Spectrum” by Maja Lujan Niemeyer, Eiichiro Komatsu, José Luis Bernal, Chris Byrohl, Robin Ciardullo, Olivia Curtis, Daniel J. Farrow, Steven L. Finkelstein, Karl Gebhardt, Caryl Gronwall, Gary J. Hill, Matt J. Jarvis, Donghui Jeong, Erin Mentuch Cooper, Deeshani Mitra, Shiro Mukae, Julian B. Muñoz, Masami Ouchi, Shun Saito, Donald P. Schneider and Lutz Wisotzki, 3 March 2026, The Astrophysical Journal.
DOI: 10.3847/1538-4357/ae3a98
Never miss a breakthrough: Join the SciTechDaily newsletter.
Follow us on Google and Google News.
[ad_2]
Source link