
Table of Contents
In 2010, a megawatt-hour of utility-scale solar electricity cost roughly $360 to produce. By 2021 the same megawatt-hour cost about $50, according to IRENA’s cost database. Sunlight did not change. Factory scale, thinner silicon wafers and a decade of learning-by-doing did the work. That price collapse conjured an industry worth hundreds of billions of dollars a year and rewrote power economics from Texas to Gujarat.
Strip away the novelty and most technologies tell a version of that story: a technical change, a long slide in cost, then a slow rearrangement of who works where, what things cost and which places get rich. The effects are rarely visible in a single quarter. Over ten years they are impossible to miss.
Productivity is where innovation shows up first
In 1987 Robert Solow quipped that you could see the computer age everywhere but in the productivity statistics. He was right for about a decade. Between 1996 and 2004, US labour productivity grew close to 2.7% a year as firms finally rebuilt their workflows around cheap computing. Then it sagged back to roughly 1.2% through the 2010s, even as phones got smarter every single year.
That pattern matters because productivity, measured as output per hour worked, sets the ceiling on everything else. Wages can rise for a while without it, but not for decades. Tax revenue, pension funding, the price of a haircut relative to a laptop: all of it leans on how much a worker can produce in an hour.

The mechanism is unglamorous. A scheduling algorithm that saves a logistics planner four hours a week is worth little on its own. Multiply it across 3,000 warehouses and the savings become capital available for hiring, or price cuts, or both.
Jobs get rearranged, not simply deleted
Automatic teller machines arrived in US banks through the 1970s and 1980s, and everyone expected tellers to disappear. The number of tellers roughly doubled between 1970 and 2010. Branches got cheaper to open, banks opened more of them, and tellers shifted from counting cash to selling mortgages and calming angry customers. The role changed; the headcount grew.
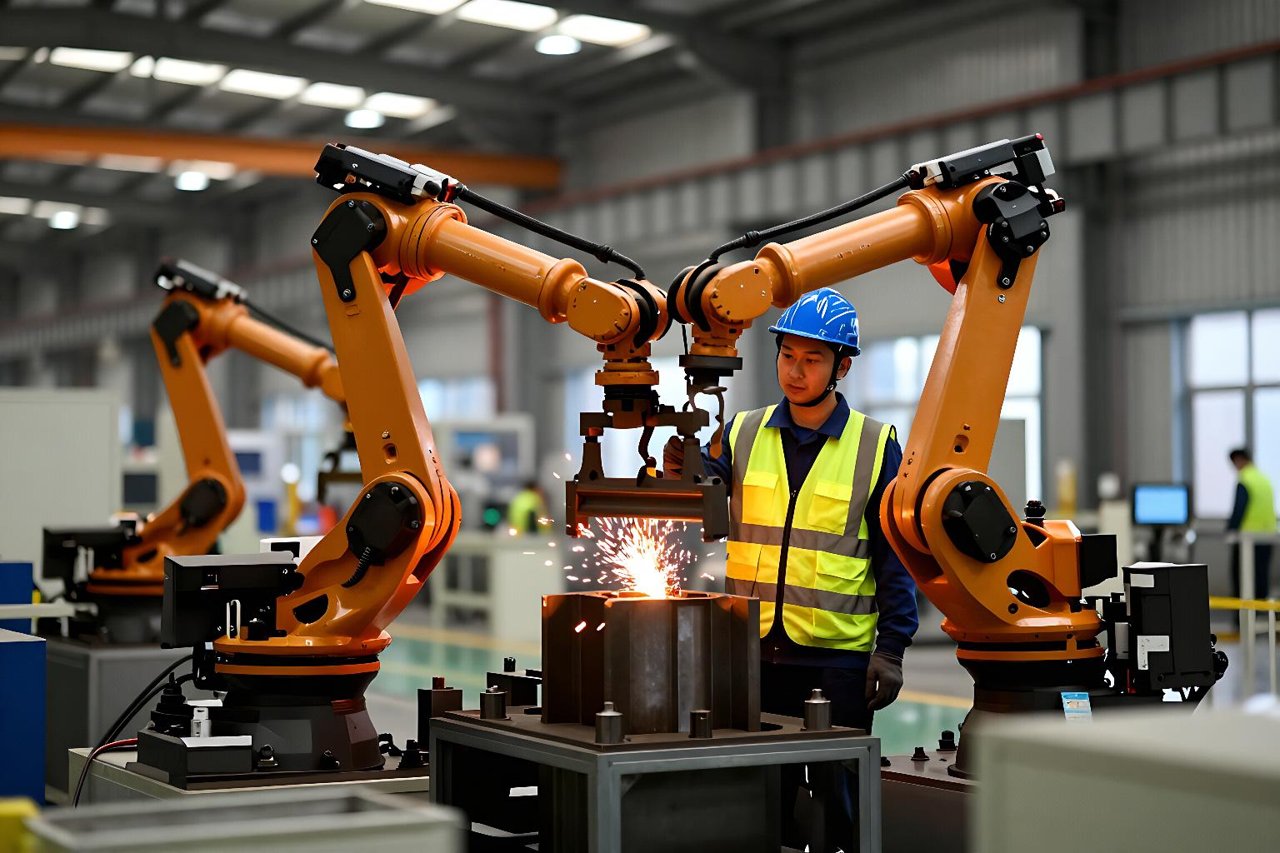
Manufacturing tells the opposite story. US factory output sits near record highs, yet factory employment is around 12.8 million, down from 19.6 million in 1979. Robots and process design did not eliminate manufacturing. They eliminated the version of it that employed a third of the town.
Three things tend to happen at once when a technology lands:
- Tasks vanish. Payroll clerks, toll booth operators and film lab technicians did specific work that stopped needing people.
- Adjacent roles expand. Cheap e-commerce logistics created demand for warehouse automation technicians, last-mile dispatchers and returns analysts.
- New categories appear that nobody forecast. Nobody in 2005 was hiring cloud security engineers, drone compliance officers or app-store optimisation consultants, because those jobs did not exist.
The friction sits in the transition, not the destination. A 52-year-old coal plant electrician and a 24-year-old data centre technician are not interchangeable, even if the aggregate numbers balance out after fifteen years.
Prices fall, but only for some things
Innovation is deflationary in the sectors it touches. A 55-inch television cost about $4,000 in 2005. A better one costs $400 today. Software, phone calls, DNA sequencing, solar modules, LED lighting: prices collapse once the technology and the factories mature.
Elsewhere, costs climb. Hospital services, university tuition, childcare and construction have outrun inflation for four decades. Economists call it Baumol’s cost disease. The short version: it still takes roughly the same number of nurses and teachers today as in 1980 to deliver the same service, so wages in those sectors have to rise with the rest of the economy while output per hour barely moves.
The parts innovation misses
This split explains a lot of household frustration. Paycheques buy dramatically more computing power, entertainment and calories than they did in 1990, and noticeably less healthcare and housing. Innovation in logistics and retail quietly did enormous work on the first basket. The second basket has absorbed most of the gains.
Innovation clusters into specific places
Technology does not spread evenly. It concentrates where engineers, capital and customers are already dense. Shenzhen turned from fishing villages and farmland into a manufacturing ecosystem of the sort that takes decades to replicate. Austin, Seattle and Cambridge, Massachusetts all pulled in talent at rates their housing stock could not match.
When a city’s productivity rises and its housing supply does not, the gains get capitalised into rent and land values. San Francisco’s median home value roughly doubled between 2012 and 2022, a wealth transfer to existing owners and a barrier to everyone else. Remote work since 2020 has pushed some activity outward, though the deep clusters held on.
The payoff always arrives late
Electricity was commercially available in the 1880s. The big productivity jump in US manufacturing came around 1920. The reason is that factories had to be rebuilt. Early plants simply swapped a steam engine for an electric motor and kept the old layout of shafts and belts running through the building. Real gains came from redesigning the factory around small motors fitted to each machine.
Software followed the same curve, and AI is following it now. A 2023 study of customer service agents found that AI assistance raised productivity by about 14% on average and 34% for the least experienced staff. Those are real numbers from a controlled setting. Turning them into economy-wide statistics requires thousands of firms to rewrite job descriptions, retrain managers and rebuild processes that nobody has questioned since 2015.
Who actually keeps the gains
Innovation creates a bigger pie, but the slices are decided by bargaining power, ownership and market structure. Labour’s share of US income has drifted from about 64% in 2000 to roughly 56% today, with the decline concentrated in industries where a handful of firms hold the platforms and the patents. When three companies control the marketplace, efficiency gains tend to land in margins rather than wages.
Consumers still capture plenty that never shows up in GDP. Free search, maps and messaging deliver value that surveys put in the tens of dollars per person per month, and none of it appears as a transaction. Statisticians have started experimenting with measures that ask people what they would need to be paid to give a service up. The answers are substantial.
What small businesses feel first
A 20-person logistics firm in 2005 needed a server room, a leased line and an IT contractor. AWS launched S3 in 2006 and turned that capital expense into a monthly bill of a few hundred dollars. AI tooling is on the same path: inference costs for capable models fell by more than 90% in about 18 months, which puts automation within reach of a plumbing supplier that would never have hired a data scientist.
Adoption is fast and uneven. Small firms can switch tools in a week because they have no procurement committee. They also lack the slack to absorb a failed migration, which is why so many end up running new software on top of processes designed for paper.
What to watch instead of the headlines
Ignore the launch announcements and watch four things. Unit labour costs tell you whether efficiency is reaching the average firm. Business dynamism, measured by new firm formation, shows whether the technology is lowering barriers or raising them. Job postings for genuinely new titles reveal where demand is landing. Electricity demand is, quietly, one of the best real-time proxies for how much computing capacity the economy is actually running.
None of those indicators move quickly, which is the point. Technological innovation affects the economy the way compound interest does: unremarkable month to month, decisive across a decade, and almost always visible first in the cost of something ordinary.


